Project Design
FTSN consists of a network of temperature sensors and four major components, these components are the data harvester, data router, machine learning algorithm and lastly the user interface.


Looking at this basic overview you can see the basic functions of FTSN. Our data is being obtained via a bluetooth API by our Raspberry Pi and then being distributed to the machine learning module and the UI.

The ML algorithm development is based off research done by Ayanoglu and located in his paper, Time Series Prediction for Node Replacement in Self Adjusting Wireless Sensor Networks. The machine learning algorithm created will be a convolutional neural network (CNN). CNNs are generally used in the field of image processing, however, they can also be applied to time-series forecasting of data. Once a CNN model has been trained, it can take the data from the sensors that are working and predict the data that is missing.
Software Overview
With the User Interface our biggest goal was to provide an intuitive and efficient controller for our users to quickly access their sensor data and see the machine learning algorithm working in real time. As can be seen in our conceptual design we aimed to display all four sensors and their respective data in both a standard temperature reading that is updated with the corresponding sample time of the sensors, and in a time graph which is constantly comparing the sensor data that is being read from all four sensors. After the machine learning module recognizes the failure scenario and begins learning and adapting to the situation the UI will begin to receive the predicted data and display this data versus the measured value of the sensor that failed.

Hardware Overview
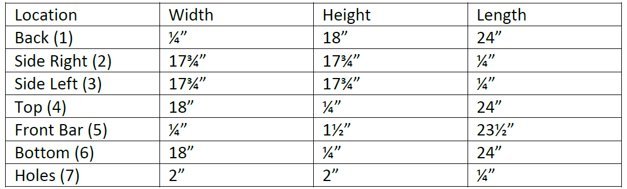
To accurately simulate and test our system we needed an environment that would could supply an environment where FTSN would be used in the real world, to do this we designed and built a wooden test box that could create a random temperature environment like the one displayed on the homepage.


The main material for the construction of the test environment was plywood. The front was made from a polycarbonate material so that the inside of the container can be seen. Note that the top of the box should be connected by hinges to allow for different configurations of sensor locations.

The heating and cooling of the box will be controlled by the same component a PTC Thermistor Heater Element with a Fan.
-Contains an adjustable PTC heater with a 12V fan in front to blow out hot air.
Specs:
Voltage: 110V
Rated power: 250W; 350W(Optional)
Working voltage of fan: 12V; 24V (Optional)
200C Radiator
Dimensions:
Approx. 90 x 61 x 42mm / 3.5 x 2.4 x 1.7in

To control the PTC Heating Element, two relays and a 12V H-Bridge will be used.
The two relays will control the state of the PTC heaters.
The H-Bridge will be used to control the airflow direction of the two 12VDC fans.

All of these components will be implemented and controlled using an Arduino Microcontroller. Using the Arduino IDE, we will be able to write a program that can produce a random temperature gradient within the test chamber using the PTC fans.


Moving to PCB
PCB Designs needed to implement hardware discussed above.
Final PCB Product
